Seven years ago I attended a seminar by Edward Tufte that described how to effectively display quantitative data. I recently ran across the notes from this seminar and was reminded of a few key points that are relevant to data in the K-12 setting. One of Tufte’s Grand Principles was that any data display must “enforce visual comparison”. In other words, we must always ask the question, “compared to what?”.
To “enforce comparison” be sure to: (1) select a relevant comparative dataset, (2) place the comparative data on the same graphic (or minimally on the same page), and (3) acknowledge the comparative data in the descriptive phase of any data dialogue.
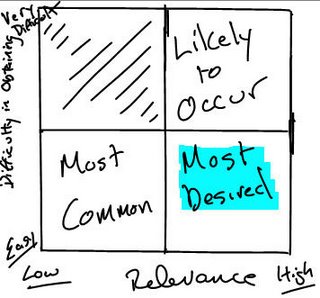
The relevance of the comparative dataset can be measured on two-dimensional grid (crappy image drawn on tablet PC above--will work on photoshop soon) with relevance on the x-axis and the difficulty of acquiring the comparison on the y-axis. The ideal scenario is to obtain extremely relevant comparison without considerable effort. Highly relevant comparative data would be from schools are classrooms that are demographically similar. The most common occurrence is that we obtain comparative data that marginally relevant, but easy to obtain. For example, when we compare the performance of students within a school to all the other students nationally without taking into account demographic or longitudinal growth factors. Since highly relevant comparative are often difficult to obtain and can require some statistical or technical sophistication to distill, teachers are often reduced to using the less relevant data. This is not a total loss and should not be used to undermine the value of student performance data. Instead, teachers and administrators should ask for more relevant comparative data from central administration and test vendors. In addition, schools should work to create examples of highly relevant comparative datasets by comparing students and classrooms within the school.
Visual design is often overlooked in presenting student, school, or district achievement data. Data displays are often sloppy and fail to place comparative data that are necessary for analysis in proximity with the school data. It is important to place the comparative on the same graphic or minimally on the same page.
High quality fact-based statements about student data of any kind reference comparative datasets. Avoid simply saying, “3rd grade students scored 65% proficient or above on the CSAP in 2006.” Even saying, “3rd grade students scored 65% proficient or above on the CSAP in 2006, which is a 4% improvement from 2005” is unsatisfactory because the 2005 data are not necessarily a relevant comparative dataset (different students in a different year). On the other hand, saying “3rd grade students at Betcher Elementary school score 25 scale score points higher on vocabulary than demographically similar students from across the district” makes a statement of performance relative to a relevant comparative dataset.
While Tufte is focused on effective use of visual display to convey a message (make a causal statement), his principle of Enforce Comparison is extremely relevant as a basic starting point for educators engaged in data-driven decision making.
No comments:
Post a Comment